Real-time Monitoring of PROTAC and Molecular Glue Targeted Degradation in Living Cells
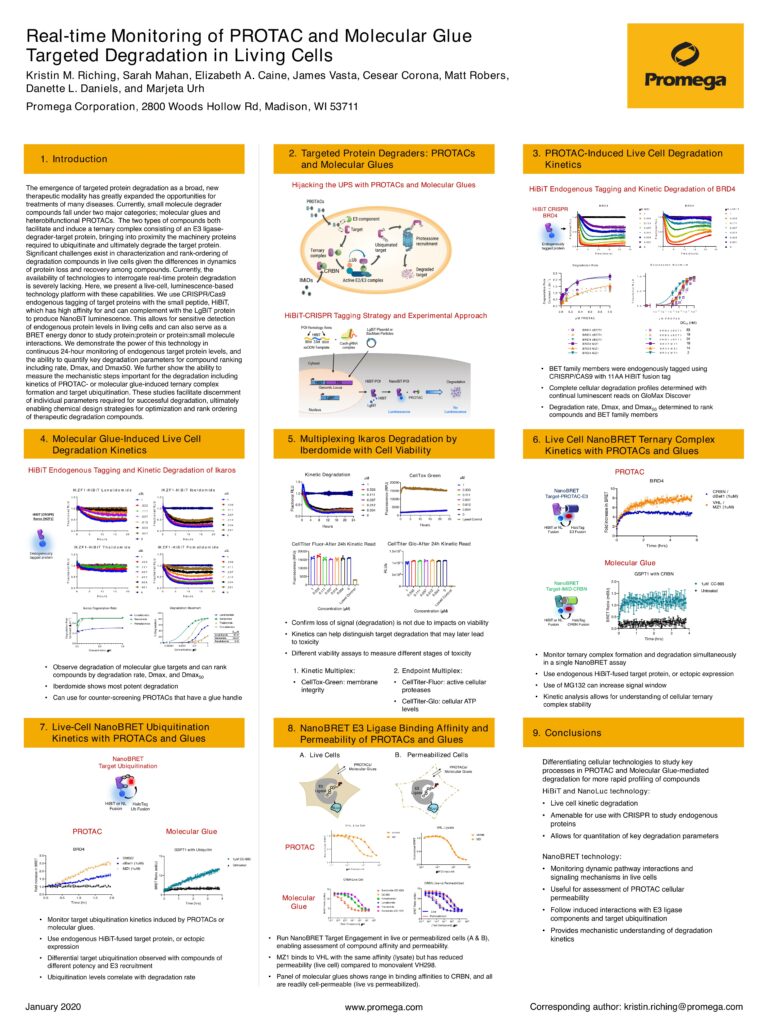
www.promega.com Real-time Monitoring of PROTAC and Molecular Glue Targeted Degradation in Living Cells Kristin M. Riching, Sarah Mahan, Elizabeth A. Caine, James Vasta, Cesear Corona, Matt Robers, Danette L. Daniels, and Marjeta Urh Promega Corporation, 2800 Woods Hollow Rd, Madison, WI 53711 January 2020 1. Introduction 4. Molecular Glue-Induced Live Cell Degradation Kinetics 7. Live-Cell NanoBRET Ubiquitination Kinetics with PROTACs and Glues 2. Targeted Protein Degraders: PROTACs and Molecular Glues 5. Multiplexing Ikaros Degradation by Iberdomide with Cell Viability 8. NanoBRET E3 Ligase Binding Affinity and Permeability of PROTACs and Glues 3. PROTAC-Induced Live Cell Degradation Kinetics 6. Live Cell NanoBRET Ternary Complex Kinetics with PROTACs and Glues 9. Conclusions The emergence of targeted protein degradation as a broad, new therapeutic modality has greatly expanded the opportunities for treatments of many diseases. Currently, small molecule degrader compounds fall under two major categories; molecular glues and heterobifunctional PROTACs. The two types of compounds both facilitate and induce a ternary complex consisting of an E3 ligasedegrader-target protein, bringing into proximity the machinery proteins required to ubiquitinate and ultimately degrade the target protein. Significant challenges exist in characterization and rank-ordering of degradation compounds in live cells given the differences in dynamics of protein loss and recovery among compounds. Currently, the availability of technologies to interrogate real-time protein degradation is severely lacking. Here, we present a live-cell, luminescence-based technology platform with these capabilities. We use CRISPR/Cas9 endogenous tagging of target proteins with the small peptide, HiBiT, which has high affinity for and can complement with the LgBiT protein to produce NanoBiT luminescence. This allows for sensitive detection of endogenous protein levels in living cells and can also serve as a BRET energy donor to study protein:protein or protein:small molecule interactions. We demonstrate the power of this technology in continuous 24-hour monitoring of endogenous target protein levels, and the ability to quantify key degradation parameters for compound ranking including rate, Dmax, and Dmax50. We further show the ability to measure the mechanistic steps important for the degradation including kinetics of PROTAC- or molecular glue-induced ternary complex formation and target ubiquitination. These studies facilitate discernment of individual parameters required for successful degradation, ultimately enabling chemical design strategies for optimization and rank ordering of therapeutic degradation compounds. Corresponding author: kristin.riching@promega.com IMiDs CRBN • BET family members were endogenously tagged using CRISRP/CAS9 with 11AA HiBiT fusion tag • Complete cellular degradation profiles determined with continual luminescent reads on GloMax Discover • Degradation rate, Dmax, and Dmax50 determined to rank compounds and BET family members HiBiT Endogenous Tagging and Kinetic Degradation of BRD4 c c HiBiT CRISPR BRD4 Endogenously tagged protein 0 5 1 0 1 5 2 0 2 5 0 .0 0 .5 1 .0 B R D 4 T im e (h o u rs ) F ra c tio n a l R L U 1 0 .3 3 3 0 .1 1 1 0 .0 3 7 0 .0 1 2 0 .0 0 4 0 .0 0 1 0 M M Z1 0 5 1 0 1 5 2 0 2 5 0 .0 0 .5 1 .0 B R D 4 T im e (h o u rs ) F ra c tio n a l R L U 1 0 .3 3 3 0 .1 1 1 0 .0 3 7 0 .0 1 2 0 .0 0 4 0 .0 0 1 0 M d B E T 1 0 . 0 0 . 5 1 . 0 1 0 – 5 1 0 – 4 1 0 – 3 1 0 – 2 1 0 – 1 1 0 0 D e g r a d a t i o n M a x i m u m M P R O T A C F r a c t i o n a l R L U B R D 2 d B E T 1 B R D 3 d B E T 1 B R D 4 d B E T 1 B R D 2 M Z 1 B R D 3 M Z 1 B R D 4 M Z 1 DC50 (nM) 83 19 34 18 14 2 0.0 0.2 0.4 0.6 0.8 1.0 0.0 0.5 1.0 1.5 2.0 2.5 D egradation R ate M P R O TA C D egradation R ate C onstant, (hr -1 ) B R D 2 dBET1 B R D 3 dBET1 B R D 4 dBET1 B R D 2 M Z1 B R D 3 M Z1 B R D 4 M Z1 0 5 1 0 1 5 2 0 0 .0 0 .5 1 .0 1 .5 IK Z F 1 -H iB iT L e n a lid o m id e H o u rs F ra c tio n a l R L U 1 .3 3 3 .1 1 1 .0 3 7 .0 1 2 .0 0 4 .0 0 1 0 µ M 0 5 1 0 1 5 2 0 0 .0 0 .5 1 .0 1 .5 IK Z F 1 -H iB iT Ib e rd o m id e H o u rs F ra c tio n a l R L U 1 .3 3 3 .1 1 1 .0 3 7 .0 1 2 .0 0 4 .0 0 1 0 µM 0 5 1 0 1 5 2 0 0 .0 0 .5 1 .0 1 .5 IK Z F 1 -H iB iT T h a lid o m id e H o u rs F ra c tio n a l R L U 1 .3 3 3 .1 1 1 .0 3 7 .0 1 2 .0 0 4 .0 0 1 0 µM 0 5 1 0 1 5 2 0 0 .0 0 .5 1 .0 1 .5 IK Z F 1 -H iB iT P o m a lid o m id e H o u rs F ra c tio n a l R L U 1 .3 3 3 .1 1 1 .0 3 7 .0 1 2 .0 0 4 .0 0 1 0 µM HiBiT (CRISPR) Ikaros (IKZF1) Endogenously tagged protein 0 20 40 60 80 100 0.000001 0.0001 0.01 1 Degradation Maximum Concentration, M % Degradation Lenalidomide Iberdomide Thalidomide Pomalidomide Dmax50 Lenalidomide 40nM Iberdomide 300pM Pomalidomide 8nM 0.0 0.5 1.0 0.0 0.2 0.4 0.6 Ikaros Degradation Rate Concentration, M Degradation Rate Constant, (hr -1 ) Lenalidomide Iberdomide Pomalidomide • Observe degradation of molecular glue targets and can rank compounds by degradation rate, Dmax, and Dmax50 • Iberdomide shows most potent degradation • Can use for counter-screening PROTACs that have a glue handle HiBiT Endogenous Tagging and Kinetic Degradation of Ikaros 0 5 10 15 20 25 0 5000 10000 15000 20000 CellTox Green Hours Fluorescence (RFU) 1 0.333 0.111 0.037 0.012 0.004 0 Lysed Control M 1 0.3 0.111 0.037 0.012 0.0 4 0 Lysed Control 0 5000 10000 15000 20000 CellTiter Fluor-After 24h Kinetic Read Concentration (M) Fluorescence (RFU) 1 0.3 0.111 0.037 0.012 0.0 4 0 Lysed Control 0 5×10 6 1×10 7 1.5×10 7 CellTiter Glo-After 24h Kinetic Read RLUs Concentration (M) 0 4 8 12 16 20 24 0.0 0.5 1.0 1.5 Kinetic Degradation Hours Fractional RLU 1 0.333 0.111 0.037 0.012 0.004 0 M • Confirm loss of signal (degradation) is not due to impacts on viability • Kinetics can help distinguish target degradation that may later lead to toxicity • Different viability assays to measure different stages of toxicity 1. Kinetic Multiplex: • CellTox-Green: membrane integrity 2. Endpoint Multiplex: • CellTiter-Fluor: active cellular proteases • CellTiter-Glo: cellular ATP levels 0 2 4 6 0 2 4 6 8 10 BRD4 Time (hrs) Fold increase in BRET CRBN / dBet1 (1uM) VHL / MZ1 (1uM) • Monitor ternary complex formation and degradation simultaneously in a single NanoBRET assay • Use endogenous HiBiT-fused target protein, or ectopic expression • Use of MG132 can increase signal window • Kinetic analysis allows for understanding of cellular ternary complex stability 0 1 2 3 4 0.0 0.5 1.0 1.5 2.0 GSPT1 with CRBN Time (hrs) BRET Ratio (mBU) 1M CC-885 Untreated NanoBRET Target-PROTAC-E3 HiBiT or NL Fusion HaloTag E3 Fusion NanoBRET Target-IMiD-CRBN HiBiT or NL Fusion HaloTag CRBN Fusion PROTAC Molecular Glue PROTAC 0.0 0.5 1.0 1.5 2.0 0.5 1.0 1.5 2.0 2.5 3.0 BRD4 Time (hr) Fold increase in BRET DMSO dBet1 (1uM) MZ1 (1uM) Ub Ub Ub Ub HiBiT or NL Fusion HaloTag Ub Fusion NanoBRET Target Ubiquitination 0 1 2 3 4 5 10 15 GSPT1 with Ubiquitin Time (hrs) BRET Ratio (mBU) 1M CC-885 Untreated Molecular Glue 10 -4 10 -3 10 -2 10 -1 10 0 10 1 10 2 0 5 10 15 [Test Compound], M BRET Ratio (mBu) Thalidomide Pomalidomide Lenalidomide Avadomide (CC-122) Iberdomide (CC-220) CC-885 CRBN Live Cell 10 -4 10 -3 10 -2 10 -1 10 0 10 1 10 2 0 5 10 15 CRBN Live vs Permeabilized [Test Compound], M BRET Ratio (mBu) Live Permeabilized • Run NanoBRET Target Engagement in live or permeabilized cells (A & B), enabling assessment of compound affinity and permeability. • MZ1 binds to VHL with the same affinity (lysate) but has reduced permeability (live cell) compared to monovalent VH298. • Panel of molecular glues shows range in binding affinities to CRBN, and all are readily cell-permeable (live vs permeabilized). A. Live Cells B. Permeabilized Cells NLuc E3 Ligase PROTACs/ Molecular Glues 10 -4 10 -2 10 0 10 2 0.0 0.5 1.0 VHL, Lysate M Compound Normalized BRET VH298 MZ1 1 0 -4 1 0 -2 1 0 0 1 0 2 0 .0 0 .5 1 .0 V H L , L iv e C e ll M C o m p o u n d N o rm a liz e d B R E T V H 2 9 8 M Z1 CDK E3 Ligase NLuc PROTACs/ Molecular Glues • Monitor target ubiquitination kinetics induced by PROTACs or molecular glues. • Use endogenous HiBiT-fused target protein, or ectopic expression • Differential target ubiquitination observed with compounds of different potency and E3 recruitment • Ubiquitination levels correlate with degradation rate Differentiating cellular technologies to study key processes in PROTAC and Molecular Glue-mediated degradation for more rapid profiling of compounds HiBiT and NanoLuc technology: • Live cell kinetic degradation • Amenable for use with CRISPR to study endogenous proteins • Allows for quantitation of key degradation parameters NanoBRET technology: • Monitoring dynamic pathway interactions and signaling mechanisms in live cells • Useful for assessment of PROTAC cellular permeability • Follow induced interactions with E3 ligase components and target ubiquitination • Provides mechanistic understanding of degradation kinetics HiBiT-CRISPR Tagging Strategy and Experimental Approach Hijacking the UPS with PROTACs and Molecular Glues PROTAC Molecular Glue www.promega.com NanoBRET™ in Live Cells as a Method to Assess E3 Ligase and Target Protein Occupancy for PROTACs James Vasta, Cesear Corona, Jennifer Wilkinson, Morgan Ingold, Chad Zimprich, Marie Schwinn, Thomas Machleidt, Jim Hartnett, Mei Cong, Frank Fan, and Matthew Robers Promega Corporation, 2800 Woods Hollow Rd, Madison, WI 53711 January 2020 1. Introduction 5. Quantitate PROTAC Occupancy at CRBN and Protein Targeted for Degradation 7. PROTAC & Precursor Permeability Measured with BRD4 & VHL NanoBRET TE Assays 2. Target Engagement (TE) using BRET 4. Assess Cellular Binding & Permeability of Small Molecules to CRBN 8. Quantitative Measurement of MDM2 TE in Live Cells with Nutlin Derivatives 6. Intracellular Affinity of IAP Inhibitors for XIAP and cIAP in Live Cells 9. Conclusions Proteolysis targeting chimeras (PROTACs) are bifunctional molecules that hijack ubiquitin E3 ligases and induce degradation of intracellular proteins through a tightly regulated proteasomal mechanism. Although several successful PROTACs have been developed against key intracellular target classes including bromodomains, kinases, and nuclear hormone receptors, these bivalent molecules often suffer from poor cell permeability due to high molecular weight. To enable a high-throughput, quantitative readout for PROTAC cell permeability and E3 ligase occupancy in living cells, we have developed a panel of NanoBRET™ target engagement (TE) assays for key E3 ligase including CRBN, VHL, XIAP, cIAP, and MDM2. NanoBRET target engagement (TE) intracellular assays are the first biophysical method to enable the quantitative determination of compound occupancy, potency, and residence time for specific target proteins inside living cells using bioluminescent resonance energy transfer (BRET). This method has previously been applied to several other protein classes including kinases, bromodomains, and HDACs. Here, we demonstrate that the NanoBRET platform allowed assessment of PROTAC cell permeability & E3 ligase occupancy. Using NanoBRET TE assays for proteins targeted by the E3 ligases, we obtained intracellular PROTAC binding kinetics. We further extend the analysis of PROTAC permeability as a dynamic process in real-time, using BRD-targeting MZ1 and dBET1 as a model system. Together these approaches allow a mechanistic interrogation of intracellular PROTAC permeability, E3 ligase occupancy, target occupancy, and target residence time. NanoBRET TE assays broadly enable the quantitative determination of compound affinity/potency and occupancy for specific targets inside cells • NanoBRET TE has been successfully used to interrogate live cell compound engagement for hundreds of intracellular targets, spanning a variety of protein classes in the human proteome. • Cell permeable NanoBRET Tracers have been developed that allow TE assays for >200 full length kinases and five E3 ligases. PROTACs, molecular glues, and small molecule inhibitors for E3 ubiquitin ligases can be assessed by NanoBRET TE assays • Assays have been developed for the E3 ligases or adapter proteins including CRBN, VHL, XIAP, cIAP1, and MDM2 • NanoBRET TE assays can be run in live and lytic mode that aids in understanding compound permeability. • NanoBRET TE live cell assays can be run in real-time to allow examination of kinetics of intracellular binding. The NanoBRET TE method should facilitate the development of PROTAC and E3 ligase inhibitors with optimal cell permeability and target occupancy NanoBRET is a trademark of Promega Corporation NanoLuc is a registered trademark of Promega Corporation Corresponding author: matt.robers@promega.com 3. NanoBRET Target Engagement is Applicable to Multiple Target Classes Nluc BRET Target 10 -8 10 -6 10 -4 10 -2 10 0 10 2 0 20 40 60 80 100 ALP CARV LAB NAD PIND PROP SOT TIM [Antagonist], M Normalized Ratio 2-AR in HEK293 1 0 – 4 1 0 – 3 1 0 – 2 1 0 – 1 1 0 0 1 0 1 1 0 2 0 1 0 2 0 3 0 4 0 5 0 [ C o m p o u n d ] , M B R E T R a t i o ( m B u ) d B E T 1 d B E T 6 B R D 4 ( C R I S P R ) i n H E K 2 9 3 10 -5 10 -4 10 -3 10 -2 10 -1 10 0 10 1 10 2 0 20 40 60 80 100 [Compound], M Normalized Ratio EPZ-6438 4896 GSK-126 GSK-343 4897 4898 5614 EZH2 (PRC2) in HEK293 10 -4 10 -3 10 -2 10 -1 10 0 10 1 10 2 -20 0 20 40 60 80 100 120 [Compound], M Normalized Ratio HDAC6 in HeLa Mocetinostat SAHA M3444 TSA MS275 ACY1215 Panibinostat 1 0 – 3 1 0 – 2 1 0 – 1 1 0 0 1 0 1 1 0 2 0 5 1 0 1 5 2 0 2 5 3 0 [ C o m p o u n d ] , M B R E T R a t i o ( m B u ) C r i z o t in ib C T x – 0 2 9 4 8 8 5 K W – 2 4 4 9 S t a u r o s p o r in e H P K 1 ( C R I S P R ) i n J u r k a t Transfection 1 0 – 5 1 0 – 4 1 0 – 3 1 0 – 2 1 0 – 1 1 0 0 1 0 1 1 0 2 0 1 0 2 0 3 0 [ C o m p o u n d ] , M B R E T R a t i o ( m B u ) A b e m a c i c l ib D in a c i c l ib P a lb o c i c l ib R ib o c i c l ib C D K 6 / C y c l i n D 1 i n H E K 2 9 3 Endogenous via CRISPR Test compound Tracer [Compound/Inhibitor] BRET Affinity / Potency Determinations • BRET is achieved by the luminescent energy transfer from NanoLuc® luciferase to the fluorescent tracer that is bound to the target proteinluciferase fusion protein. • The NanoBRET assay is specific for the target fused to NanoLuc, since BRET assays are governed by tight distance constraints between energy donor (NanoLuc) and energy acceptor (tracer). • NanoBRET assays are conducted in live cells that allow equilibrium binding analysis and real time binding analysis. NanoLuc-target fusion gene delivery is most often done via transfection for transient or stable expression. Additionally, fusion genes can be introduced to cells by CRISPR editing or viral particles. 10 -4 10 -3 10 -2 10 -1 10 0 10 1 10 2 0 10 20 30 [Test Compound], M BRET Ratio (mBu) BV-6 LCL-161 10 -4 10 -3 10 -2 10 -1 10 0 10 1 10 2 0 10 20 30 40 50 [Test Compound], M BRET Ratio (mBu) BV-6 LCL-161 BRD4 NLuc VH298 VHL Inhibitor (MZ1 precursor) MZ1 (+) JQ1- based PROTAC VHL NLuc VHL (+) JQ1 Pan-BET inhibitor (MZ1 precursor) 10 -5 10 -4 10 -3 10 -2 10 -1 10 0 10 1 10 2 0 20 40 60 80 [Compound], M BRET Ratio (mBu) VH298 MZ1 VHL, Live Cells 1 0 – 5 1 0 – 4 1 0 – 3 1 0 – 2 1 0 – 1 1 0 0 1 0 1 1 0 2 0 1 0 2 0 3 0 4 0 [ C o m p o u n d ] , M B R E T R a t i o ( m B u ) M Z 1 J Q 1 B R D 4 , L i v e C e l l s 5 0 1 0 0 1 5 0 0 . 1 1 1 0 T i m e ( m ) I C 5 0 ( M ) d B E T 1 J Q – 1 B R D 4 E n g a g e m e n t M Z 1 1 0 – 5 1 0 – 4 1 0 – 3 1 0 – 2 1 0 – 1 1 0 0 1 0 1 1 0 2 0 2 0 4 0 6 0 8 0 1 0 0 1 2 0 [ C o m p o u n d ] , M B R E T R a t i o ( m B u ) V H 2 9 8 M Z 1 V H L , P e r m e a b i l i z e d C e l l s ( L y s a t e ) A. C. D. B. 10 -6 10 -4 10 -2 10 0 10 2 0 50 100 [Test Compound], M Normalized BRET (%) Nutlin-3a Nutlin-3b NVP-CGM097 MI-773 RG-7112 MX69 Idasanutlin Idasanutlin MI-773 Nutlin-3a Nutlin-3b • Using target BRD4 NanoBRET TE assay in live cells, The PROTAC MZ1 is less potent compared to precursor JQ1 (A ). • NanoBRET TE VHL assays were used to assess permeability of PROTAC MZ1 and precursor VH298. In live cells, the MZ1 was ~40-fold less potent than VH298 (B). Since potency values are identical in permeabilized cells (D), the shift in live cell potency is due to decreased permeability of PROTAC MZ1. • PROTAC & precursor potencies for BRD4 were measured in real time. Plotting compound IC50 vs time reveals slow equilibration of PROTACs MZ1 & dBET1 compared to JQ1 precursor (C). Bifunctional and Monofunctional Inhibitors MDM2 Nanoluc fusions were expressed in HEK293 cells. Intracellular affinity for a series of compounds for MDM2 was quantified using NanoBRET TE MDM2 Assay. 10 -4 10 -3 10 -2 10 -1 10 0 10 1 10 2 0 5 10 15 [Test Compound], M BRET Ratio (mBu) Thalidomide Pomalidomide Lenalidomide Avadomide (CC-122) Iberdomide (CC-220) CC-885 NanoBRET TE CRBN Live Cell Assay 10 -4 10 -3 10 -2 10 -1 10 0 10 1 10 2 0 5 10 15 NanoBRET TE CRBN Live vs Permeabilized Cells [Test Compound], M BRET Ratio (mBu) Live Permeabilized • NanoBRET TE CRBN assay can be run in live or permeabilized cells (A & B), enabling assessment of compound intracellular affinity and permeability. • The live cell assay was used to quantify the apparent intracellular affinity of a series of CRBN binders that are also molecular glues (A). • Using permeabilized cells (B), there was little change in IC50 observed compared to when the assay was run in live cells, indicating these compounds were readily cell permeable. • Inhibitor of Apoptosis (IAP) family of proteins are E3 ligases and are frequently over-expressed in cancer. Development of inhibitors that can induce degradation may be of therapeutic interest; both BV-6 & LCL-161 induce IAP degradation (A). • NanoBRET TE assays have been developed for two of the IAP family members, XIAP and cIAP1. Intracellular affinity for the IAP inhibitors BV-6 and LCL-161 were determined for both XIAP and cIAP1 in HEK293 cells (B & C). BV-6 LCL-161 A. PROTACs tested vary in the linkers connecting CRBN & BRD ligands. B. NanoBRET TE was used to quantitate PROTAC affinity for the BRD4 target in live HEK293 cells, showing dBET6 is 100-fold more potent. This can be a result of increased affinity for BRD4 target or cellular permeability. C. To understand PROTAC permeability, NanoBRET TE assays can be run in live or permeabilized cells. Comparing results from NanoBRET TE CRBN assay in live cells to permeabilized cells revealed that, 1) dBET6 is more permeable than dBET1; and 2) dBET6 is slightly more potent then dBET1. 10 -4 10 -3 10 -2 10 -1 10 0 10 1 10 2 0 10 20 30 40 50 [Test Compound], M BRET Ratio (mBu) dBET1 dBET6 BRD4 NanoBRET TE Live cells B. C. 10 -4 10 -3 10 -2 10 -1 10 0 10 1 10 2 0 50 100 [Test Compound], M Normalized BRET (%) Live dBET1 Live dBET6 Permeabilized dBET1 Permeabilized dBET6 CRBN NanoBRET TE Live & Permeabilized Cells A. BET-BRD PROTACs Tested dBET1 PROTAC based on (+) JQ1 inhibitor dBET6 PROTAC derivative of dBET1 NLuc CRBN (E3) Small Molecule CRBN Binders/ Molecular Glues A. Live Cells B. Permeabilized Cells CDK NLuc CRBN (E3) A. IAP Inhibitors/Antagonists Tested B. NanoBRET TE XIAP Live cells C. NanoBRET TE cIAP1 Live cells For Research Use Only. Not for use in diagnostic procedures. • Iberdomide • CC-885 • Pomalidomide • Lenalidomide • Thalidomide • Avadomide www.promega.com Broad Kinome Selectivity and Residence Time Analysis in Live Cells with NanoBRET Matthew Robers1 , James Vasta1 , Takeomi Inoue 2 , Aki Emi 2 , Yusuke Kawase 2 Cesear Corona1 , Jennifer Wilkinson1 , Chad Zimprich1 , Morgan Ingold1 , Mei Cong1 , and Frank Fan1 1Promega Corporation, 2800 Woods Hollow Rd, Madison, WI, 53711; 2 Carna Biosciences, Inc., BMA, 1-5-5, Minatojima-Minamimachi, Chuo-ku, Kobe 650-0047, Japan January 2020 1. Introduction 5. Broad Kinome Profiling In Live Cells Reveals Improved Selectivity 2. Target Engagement (TE) using BRET 3. Live Cell Quantitative TE Assays for >200 Full-Length Kinases, including RTKs We present the first technique to broadly and quantitatively determine kinase inhibitor potency as well as profile kinase target engagement under physiological conditions, without disruption of cellular membrane integrity. NanoBRET™ enables a biophysical assessment of compound engagement and residence time for chosen intracellular targets. A quantitative capability is achieved in living cells, via energy transfer from cell-permeable tracers reversibly engaged to selected NanoLuc®-tagged target proteins. As the specificity of the BRET signal is dictated by the placement of NanoLuc on the chosen target, a diverse set of broad-coverage tracers support an HTS-compatible method to profile the isozymespecific affinity and binding kinetics over entire enzyme classes. This technique has enabled a quantitative analysis of compound binding against >200 individual full-length protein kinases, including a key panel of integral membrane receptors. In-cell potency determinations for various types of kinase inhibitors were achieved, including type I, II, and allosteric compounds.. Timedependent target-compound occupancy (or residence time) can also be obtained with this method. An assessment of kinetic and equilibrium selectivity of various clinically-relevant kinase inhibitors revealed different residence times for compounds with similar equilibrium affinity. The assay was extended to live cell broad kinome selectivity profiling using over 170 kinases. These cellular profiling results revealed an improved selectivity of the compound compared to results obtained by biochemical profiling. QuickScout is a registered trademark of Carna Biosciences, Inc NanoBRET is a trademark of Promega Corporation NanoLuc is a registered trademark of Promega Corporation Corresponding author: matt.robers@Promega.com 9. Conclusions Cell permeable Tracers have been developed that allow NanoBRET TE assays for >200 full length kinases. Carna Biosciences offers services to support kinase target engagement with NanoBRET. NanoBRET TE Kinase assays broadly enable the quantitative determination of compound affinity inside cells, including various Type I, II, and allosteric kinase inhibitors. Monitoring both potency and residence time in cells using NanoBRET TE assays can reveal equilibrium and kinetic selectivity of kinase inhibitors, offering unique opportunities. For kinases, intracellular selectivity and affinity profiles can differ dramatically from those determined biochemically, underscoring the need for quantitative methods to measure compound engagement and occupancy in live cells. Broad kinome profiling workflow with NanoBRET TE: • A kinase library of NanoLuc fusion constructs (178) is reverse-transfected into cells of interest, with each well expressing a unique kinase/NanoLuc fusion. On next day,, target occupancy is determined via NanoBRET. Once occupancy is determined, compound affinity can be determined subsequently. • A comparison of occupancy vs inhibition of 1mM crizotinib in NanoBRET versus cell-free (Carna Biosciences). In live cells, crizotinib is more selective for MET and ALK. Kinase/NanoLuc ® Diversity Set Tracers Test Compounds 0 1 2 3 4 0 1 2 3 4 P h o s h p o – E L I S A , L o g I C 5 0 ( n M ) T a r g e t E n g a g e m e n t , L o g I C 5 0 ( n M ) M E T A L K A X L T R K B T IE 2 T R K A A B L 1 L C K IN S R R 2 = 0 . 9 5 1 0 – 5 1 0 – 4 1 0 – 3 1 0 – 2 1 0 – 1 1 0 0 1 0 1 1 0 2 0 3 6 9 1 2 [ C o m p o u n d ] , m M B R E T R a t i o ( m B u ) G N F 2 I m a t in ib D a s a t in ib P o n a t in ib A b l A B L – 0 0 1 Test compound Tracer Affinity / Potency Determinations 8. Kinetic Selectivity with a Reversible Covalent Inhibitor Inverted Cyanoacrylamide Electrophile Kinase Recognition Kinase Cys 10 -6 10 -5 10 -4 10 -3 10 -2 10 -1 10 0 10 1 10 2 0 20 40 60 80 100 Compound 4 Equilibrium Analysis [Compound 4], uM Normalized BRET BLK BTK TEC 50 100 150 200 250 -20 0 20 40 60 80 100 120 Compound 4 Residence Time In Cell Time (min) Normalized BRET BLK Vehicle (BTK) BTK TEC Ibrutinib (BTK) A. The reversible covalent inhibitor compound 4 (Nature Chem. Bio. 11:525 (2015)), provided by Michael Bradshaw of Principia Biopharma, targets a non-catalytic cysteine in BTK. B. It shows similar cellular potencies for BLK, BTK, & TEC using NanoBRET TE kinase assays. C. Compound 4 shows kinetic selectivity for BTK using NanoBRET TE kinase residence time analysis. Ibrutinib was used as a control, as it’s a covalent BTK inhibitor targeting the same cysteine in BTK. Compound 4 A. B. C. 10 -6 10 -5 10 -4 10 -3 10 -2 10 -1 10 0 0 10 20 30 40 [Compound], mM BRET Ratio (mBu) Merestinib Glesatinib Savolitinib Cabozantinib Foretinib Capmatinib MMEETT Impacts of clinical mutations 10 -5 10 -4 10 -3 10 -2 10 -1 10 0 10 1 0 10 20 30 40 [Compound], mM BRET Ratio (mBu) Merestinib Glesatinib Savolitinib Cabozantinib Foretinib Capmatinib MET (D1228V) Selectivity among similar targets 10 -5 10 -4 10 -3 10 -2 10 -1 10 0 10 1 10 2 0 20 40 60 80 100 120 [Crizotinib] (mM) Normalized BRET ABL ALK AXL INSR TIE2 TrkA TrkB Crizotinib Target Engagement LCK MET Evaluating diverse chemical matter 4. Diverse Applications to Explore Inhibitor Pharmacology 3. Interrogating Type I, Type II, and Allosteric Kinase Inhibitors 1 0 – 5 1 0 – 4 1 0 – 3 1 0 – 2 1 0 – 1 1 0 0 1 0 1 1 0 2 0 5 1 0 1 5 2 0 2 5 B T K [ C o m p o u n d ] , m M B R E T R a t i o ( m B U ) B o s u t i n i b D a s a t i n i b I b r u t i n i b F o r e t i n i b P o n a t i n i b R e b a s t i n i b • Top: Characterization of type I & II kinase inhibitors at BTK • Bottom: Characterization of type I, type II, & allosteric inhibitors at Abl and RIPK1 kinases NanoBRET TE experiments were performed with HEK293 cells transiently transfected with Kinase/NanoLuc® fusion proteins. A fixed concentration of tracer approximating the apparent Kd was used. 1 0 – 4 1 0 – 3 1 0 – 2 1 0 – 1 1 0 0 1 0 1 1 0 2 4 5 6 7 8 9 1 0 [ C o m p o u n d ] , m M B R E T R a t i o ( m B u ) A P Y 6 9 K W – 2 4 4 9 N e c r o s t a t i n I P o n a t in ib R I P K 1 Correlation to phenotype Time (min) BRET Ratio (mBRET) 0 20 40 60 80 100 120 0 20 40 60 80 100 120 DMSO Dasatinib Ibrutinib Fenebrutinib Acalabrutinib Zanubrutinib CGI-1746 RN-486 Vecabrutinib ARQ 531 Reversible Irreversible BTK 7. Residence Time Can Be Measured with Reversible and Irreversible Inhibitors 3. Live Cell Quantitative TE Assays for >200 Full-Length Kinases, including RTKs 6. Intracellular Residence Time and Affinity May Not Always Correlate 1 mM Crizotinib, Live Cell NanoBRET TE 1 mM Crizotinib, QuickScount™ Enzyme Activity • NanoBRET can be used to evaluate both wildtype and mutant kinases, as shows for MET kinase • In live cells, NanoBRET data can correlate well with cellular functional assays such as phospho-ELISA • Target fractional occupancy can be quantified in live cells with NanoBRET. Using the tracer at or below its apparent affinity in a competitive displacement mode, results in a compound IC50 that’s a constant value and quantitative. • Intracellular residence time can be evaluated in a simple format, where test compound is added prior to the tracer. Residence Time Determinations • Equilibrium (steady-state) binding may not always correlate with binding kinetics. • Despite weaker affinity, quizartinib exhibits more durable inhibition than dovitinib following a washout of live cells. FLT3: Equilibrium Binding FLT3: Residence Time For Research Use Only Kinase t (hrs) BTK >10 TEC 9.1 BLK 1.1 HEK293 cells expressing BTK were preincubated with test compounds or vehicle (DMSO) for 2hrs at 37°C followed by a brief washout. NanoBRET Tracer K-4 was then added and BRET was repeatedly measured with the GloMax® Discover Multimode Reader (Promega) equipped with injector. Examination of Intracellular Target Engagement for Clinically Relevant Inhibitors Across the CDK Family Using NanoBRET™ Assays James Vasta, Cesear Corona, Jennifer Wilkinson, Morgan Ingold, Chad Zimprich, Marie Schwinn, Thomas Machleidt, Jim Hartnett, Mei Cong, Frank Fan, Michael Curtin, and Matthew Robers Promega Corporation, 2800 Woods Hollow Rd, Madison, WI 53711 January 2020 Residence Time Determinations Test compound Tracer [Compound/Inhibitor] BRET Affinity / Potency Determinations A. Over 20 CDKs and CDK-like proteins comprise the human kinome and play key roles in cell cycle control and transcriptional regulation. B. By introducing exogenous cyclin with NanoLuc-CDK fusions, NanoBRET TE cellular assays have been developed for >30 specific CDK-cyclin pairings or CDKLs. CDK activity is tightly regulated by interactions with numerous intracellular cyclins, resulting in many unique CDK-cyclin kinase pairs. Cdk9 Cdk12 Cdk13 Cdk20 Cdk2Cdk1 Cdk3 Cdk5 Cdk16 Cdk17 Cdk18 Cdk14 Cdk15 Cdk4 Cdk6 Cdk7 Cdk8 Cdk19 Cdk10 Cdk11 CdkL3 CdkL2 CdkL1 CdkL5 Cell cycle Transcription Unknown A. CDK Family CDK1 + Cyc B1 CDK5 + CDK5R1 CDK14 + Cyc Y CDK1 + Cyc B2 CDK5 + CDK5R2 CDK15 + Cyc Y CDK1 + Cyc E1 CDK6 + Cyc D1 CDK16 + Cyc Y CDK1 + Cyc K CDK6 + Cyc D3 CDK17 + Cyc Y CDK2 CDK7 CDK18 + Cyc Y CDK2 + Cyc A1 CDK7 + Cyc H CDK19 + Cyc C CDK2 + Cyc A2 CDK8 + Cyc C CDKL1 CDK2 + Cyc E1 CDK9 + Cyc K CDKL2 CDK3 + Cyc E1 CDK9 + Cyc T1 CDKL3 CDK4 + Cyc D1 CDK10 + Cyc L2 CDKL5 CDK4 + Cyc D3 CDK11A + Cyc K CDK5 CDK11A + Cyc L2 A. Dinaciclib is a CDK inhibitor in clinical trials with FDA orphan drug status. Potency determined for 20 CDK / cyclin pairs or CDKL using NanoBRET TE assays, in HEK293 cells. B. Cellular potency of Dinaciclib and clinically relevant CDK inhibitors Abemaciclib (Verzenio®), Palbociclib (Ibrance®), & Ribociclib (Kasqali®) for CDK6 / cyclin D1. A. Representative CDK NanoBRET TE Assays B. CDK6 / Cyclin D1 NanoBRET TE Assays A. Cellular selectivity profile of Dinaciclib identifies primary targets of CDKs 1 – 6 & 9, & binding to several cyclin Y CDKs (CDKs 14-18). Dinaciclib intracellular potency can depend on cyclin pairing. B. Cellular selectivity profile of the selective CDK inhibitor Abemaciclib reveals the primary targets CDKs 4 & 6. Also, it binds CDKs 14-18. Abemaciclib intracellular potency can depend on cyclin pairing. B. Abemaciclib (LY2835219) 1 0 – 4 1 0 – 3 1 0 – 2 1 0 – 1 1 0 0 1 0 1 1 0 2 0 5 0 1 0 0 [ D i n a c i c l i b ] , M N o r m a l i z e d B R E T ( % ) C D K 2 / c y c A C D K 2 / c y c E 0 5 0 1 0 0 1 0 – 5 1 0 – 4 1 0 – 3 1 0 – 2 1 0 – 1 1 0 0 1 0 1 1 0 2 [ A b e m a c i c l i b ] , M N o r m a l i z e d B R E T ( % ) C D K 6 / c y c D 1 C D K 6 / c y c D 3 A. Dinaciclib (SCH727965) NanoBRET TE cellular assays enable the study of specific CDKcyclin pairings by co-expression of CDK and cyclin pairs A. Higher intracellular potency for Dinaciclib with CDK2 / Cyclin E compared to CDK2 (lacking exogenous cyclin expression was observed. HEK293 cell were used (A). B. No cyclin bias observed with the type II inhibitor K03861 that binds CDK2 in DFG-out conformation associated with catalytically inactive kinase. HEK293 cell were used (B). 0 5 0 1 0 0 1 0 – 4 1 0 – 3 1 0 – 2 1 0 – 1 1 0 0 1 0 1 1 0 2 [ D i n a c i c l i b ] , M N o r m a l i z e d B R E T ( % ) C y c E N o C y c l in C D K 2 1 0 – 4 1 0 – 3 1 0 – 2 1 0 – 1 1 0 0 1 0 1 1 0 2 0 5 0 1 0 0 [ K 0 3 8 6 1 ] , M N o r m a l i z e d B R E T ( % ) N o C y c l in C y c E C D K 2 Allosteric site (DGF-out) CycE CDK2 DGF-in Corresponding author: matt.robers@promega.com 50 100 0 10-3 10-2 10-1 100 101 102 [TL12-186], M Normalized BRET (%) CRBN NanoBRET TE 1 0 – 4 1 0 – 3 1 0 – 2 1 0 – 1 1 0 0 1 0 1 1 0 2 0 5 0 1 0 0 [TL12-186], M N o r m a l i z e d B R E T ( % ) C D K 2 / C y c E 1 C D K 7 C D K 9 / C y c K CRBN Kinase TL-12-186 CRBN Tracer Kinase Tracer A. NVP-2 is CDK9 selective, while Dinaciclib inhibits several CDKs. NanoBRET TE showed both compounds had similar cellular affinity for CDK9 / cyclin T1 (A). B. Despite the similar intracellular affinity, NVP-2 has a longer intracellular residence time compared to dinaciclib, demonstrating that affinity and residence time don’t always correlate (B). 5 .0 7 .5 1 0 . 0 1 2 . 5 1 5 . 0 1 0 – 4 1 0 – 3 1 0 – 2 1 0 – 1 1 0 0 1 0 1 1 0 2 [ T e s t C o m p o u n d ] , M B R E T R a t i o ( m B u ) C D K 9 / C y c l i n T 1 D in a c ic l ib N V P – 2 0 5 0 1 0 0 1 5 0 2 0 0 0 5 1 0 1 5 2 0 T i m e ( m ) B R E T R a t i o ( m B u ) N V P – 2 w a s h o u t D i n a c i c l i b w a s h o u t C o n t r o l ( 1 0 0 % b o u n d ) A. Equilibrium Binding B. Residence Time C D K 9 / C y c l i n T 1 Dinaciclib NVP-2 NanoBRET TE assays broadly enable the quantitative determination of compound affinity for specific targets inside cells • Cell permeable NanoBRET Tracers have been developed that allow TE assays for >200 full length kinases • For the CDK family, a suite of >30 NanoBRET TE assays enable interrogation of inhibitor potency against different CDK / cyclin pairs Cellular potency of various kinase inhibitors types is measured using NanoBRET TE assays • For CDKs, type I & II inhibitor cellular potencies have been determined • For other kinases, NanoBRET TE has been used to quantitate type I, II and allosteric compounds cellular potency Residence time for specific kinases in live cells is measured with NanoBRET TE: Using both equilibrium & residence time methods, selectivity may be revealed offering unique inhibitor development opportunities. PROTACs cellular permeability and potency for E3 ubiquitin ligases CRBN and VHL can be quantified using NanoBRET TE assays: run in live and lytic mode to assess cellular permeability of PROTACs. NanoBRET is a trademark of Promega Corporation • The NanoBRET assay is specific for the target fused to NanoLuc since BRET assays are governed by tight distance constraints between energy donor (NanoLuc) and energy acceptor (tracer) • NanoBRET assays are conducted in live cells that allow equilibrium binding analysis and real time binding analysis Long Residence BRET Short Residence Time Very Long Residence or Covalent B. K03861 – Type II Inhibitor Hinge For Research Use Only www.promega.com Cyclin-dependent kinases (CDKs) play key roles in diverse cellular functions including cell cycle control, cell proliferation, and transcriptional regulation. There are >20 CDKs in the human kinome; CDK activity is tightly regulated by interactions with intracellular cyclins. Recent clinical successes of CDK inhibitors, such as Palbociclib and Abemaciclib for breast cancer, have helped drive interests in development of new CDK inhibitors as well as heterobifunctional degraders (e.g., PROTACs). To aid in the inhibitor development for CDKs, we used NanoBRET™ target engagement (TE) technology to develop a panel of >30 specific CDK/cyclin pairings in live-cell assays. The NanoBRET TE technology enables quantitative assessment of target occupancy and residence time for kinase inhibitors and PROTACS in living cells. Using the panel of CDK-cyclin cellular assays enabled us to determine cellular compound potency and selectivity for various inhibitors. We also demonstrated cyclin dependent effect on inhibitor cellular potency, and we could quantitate intracellular binding of a promiscuous kinase PROTAC to several CDKs. Time-dependent target-compound occupancy (or residence time) can also be obtained Using NanoBRET TE assays. An assessment of kinetic selectivity of compounds with similar equilibrium affinity for CDK9-cyclin T1 was examined for CDK9-cyclin T1. Despite the similar cellular equilibrium affinity, the compounds displayed different intracellular residence times. Our results show that NanoBRET TE CDK assays can interrogate test compound potency, selectivity, target occupancy and residence time under physiologically-relevant conditions. 1. Introduction 4. Cellular Compound Potency for CDK Family, using Numerous Cyclin Pairings 7. Kinase PROTAC TE at CRBN and CDKs can be Quantified via NanoBRET 2. Target Engagement (TE) usingNanoBRET 5. Intracellular CDK Selectivity and Cyclin Bias for Clinical Drugs 3. Cyclin-Dependent Kinase Family 9. Conclusions 8. Using Cellular Affinity & Residence Time Measurements to Characterize Compounds 6. Intracellular Potency of CDK Type I & II Inhibitors • TL-12-186 is a promiscuous kinase inhibitor conjugated to a cereblon (CRBN) E3 ubiquitin ligase ligand (pomalidomide) • Intracellular binding of TL-12-186 to CRBN was quantified via CRBN NanoBRET TE assay. (left, IC50 = 0.3µM) • Intracellular binding of TL-12-186 to CDK2, CDK7, & CDK9 was quantified via NanoBRET TE. (right, IC50 0.07 – 0.3µM) CDKs NanoBRET T E 10 -4 10 -3 10 -2 10 -1 10 0 10 1 10 Normalized BRET 2 (%) CDK2 / CycE1 CDK7 CDK9 / CycK 10 -4 10 -3 10 -2 10 -1 10 0 10 1 10 2 B. NanoBRET TE Cellular CDK Assays A. Dinaciclib-Type I Inhibitor CDK2 www.promega.com A Versatile Bioluminescent Immunoassay Approach to Probe Cellular Signaling Pathway Regulation Hicham Zegzouti, Brian (Byounghoon) Hwang, Laurie Engel, Juliano Alves, and Said Goueli Promega Corporation, 2800 Woods Hollow Rd, Madison, WI 53711 January 2020 For Research Use Only. Not for use in diagnostic procedures. Corresponding author: Hicham.zegzouti@promega.com Monitoring cellular signaling events can help better understand cell behavior in health and disease. Traditional immunoassays such as ELISA or Western blot, used to study proteins involved in signaling, can be tedious, require multiple steps, and are not easily adaptable to high throughput screening (HTS). Here we describe Lumit cellular immunoassay, a novel cell-based approach where immunodetection is combined with bioluminescent enzyme subunit complementation. It is solution based, does not include washing, liquid transfer, nor immobilization steps. Therefore, cells are lysed in the same well where antibody binding and luminescence generation steps occur. Lumit immunoassays take less than two hours to complete in a homogeneous “Add and Read” format and were successfully used to monitor the activation and deactivation of multiple signaling pathways through specific nodes of phosphorylation in unmodified cells. Our results demonstrate that this technology can be broadly adapted to streamline the analysis of signaling pathways of interest or the identification of pathway specific chemical or biologic inhibitors. The bioluminescent Lumit immunoassays are based on NanoLuc Binary Technology (NanoBiT) two-subunit system (SmBiT; 11 aa peptide and LgBiT; 18 kDa fragment). In this assay, the NanoBiT subunits are fused to an anti-mouse and an anti-rabbit secondary antibodies (Lumit™ secondary antibodies). Principle of Lumit™ Immunoassay cellular system. Phosphorylated (top panel) or total (bottom panel) target proteins in lysed cells after stimulation are recognized by each primary antibody pair. The Lumit secondary antibodies then recognize their cognate primary antibodies, resulting in close proximity of the NanoBiT subunits to form a functional enzyme that generates bright luminescence. 3. Optimizing Lumit Immunoassay Cellular System for Total and Phosphorylated Targets 2. Principle of Homogeneous Lumit Immunoassay Cellular System Developing Lumit immunoassay to detect IBα phosphorylation or degradation • Selection and optimization of primary antibodies for Lumit immunoassay is fast and easy. • Bioluminescent detection of IBα protein and its phosphorylation upon NF-B pathway activation is linear with increasing cell number. • Assay is sensitive to detect total and phospho protein levels in low cell density. 1. Introduction 6. Detection of Diverse Signaling Target Proteins 5. Deciphering NF-B Pathway Activation Through Total and Phospho IBα Detection 4. Validation of Lumit Cellular Immunoassay Detection of Phosphorylated and Total IκBα • Lumit cellular immunoassays reveal the predicted biology of multiple signaling pathways upon ligand mediated activation: Quick phosphorylation of the pathway nodes such as IBα (S32), and STAT3 (Y705) or degradation of a node target such as β-Catenin with Wnt treatment. • Detection of the predicted response of the signaling pathways to node kinase or pathway inhibitor treatment: such as inhibitors of IKK complex, PI3K, and JAK2 abolishing IBα/P65, AKT and STAT3 phosphorylation, respectively. • Homogeneous Lumit Cellular immunoassays are easier and quicker than traditional Western to generate the same data. • Phosphorylation or degradation of IBα can be measured using the Lumit immunoassay in small number of cells and in a more quantitative way. Detection of total and phosphorylated targets upon signaling pathway activation and deactivation Detection of total and phospho IBα upon TNF Treatment 7. Detection of Pathway Node Kinase Inhibition with Small Molecules 9. Conclusions Benefits of the bioluminescent Lumit cellular immunoassays: • Bioluminescent, less interference from chemical compounds • Homogeneous, “Add and Read” format • No cell engineering required, detection of endogenous substrates phosphorylation • No special instrument or plate requirement. Only a luminometer is required • Less complex, quicker with less steps than Western, ELISA, or fluorescent based technologies • Amenable to HTS formatting • “Do It Yourself” format, the Lumit detecting antibodies can be adapted to any pathway of interest Reference: Hwang, B., et al. (2020) A homogeneous bioluminescent immunoassay to probe cellular signaling pathway regulation. Commun Biol 3, 8 https://rdcu.be/b0jf0 • The bioluminescent Lumit pathway assays reveal the expected pharmacology of pathway node kinase inhibitor. • The Lumit immunoassays can be used to screen inhibitors of cancer, immune and inflammatory response pathways in fast and homogeneous fashion. • High Z’ value show a great applicability of Lumit Immunoassay Cellular systems to HTS. 8. Pathway Modulation with small and Large Molecules Detected with Lumit Immunoassays • Bioluminescent Lumit immunoassays can be used to identify small and large molecule inhibitors of signaling pathways. • Pathway node phosphorylation can be used as a reporter for biologics activity at the receptor level. • Lumit p-AKT node immunoassay can be used to screen anti c-MET large molecule drugs in non-engineered cells in fast (10 min activation) and easy way. a. Lumit IBα immunoassay reveals the predicted biology of NF-B signaling pathway upon TNF treatment: IBα phosphorylation (pS32) followed by its fast degradation. No cell engineering required: therefore same results in primary cells (d and e). b. Lumit IBα immunoassay reveals the predicted response of NF-B pathway to the proteasome inhibitor MG132 treatment: decrease in IBα degradation and accumulation of phosphorylated IBα. c. Cycloheximide inhibits de novo IBα protein expression in response to long NF-B pathway activation and the Lumit immunoassay can detect easily this event. NF-B JAK/STAT mTOR/PI3K/AKT Cancer and Inflammatory Response Signaling Pathways Western blot protocol (Heterogeneous) Lumit immunoassay protocol (Homogeneous) Comparison of Lumit immunoassay and Western blot in detecting total and phospho IBα Inhibition of Insulin-induced AKT phosphorylation Inhibition of JAK/STAT pathway with chemical and biologic inhibitors Using p-AKT detection to analyze Inhibition of c-MET pathway with c-MET small and large molecule inhibitors High Throughput Screening (HTS) utility of Lumit™ cellular immunoassay www.promega.com Lumit™ Immunoassays: Bioluminescent, Sensitive, and Homogeneous Analyte Detection Using Labeled Antibodies Chris Heid, Nidhi Nath, Martha O’Brien and Dan Lazar Promega Corporation, 2800 Woods Hollow Rd, Madison, WI 53711 Abstract # 824424 January 2020 1. Introduction 4. Lumit Cytokine Immunoassays 7. Lumit FcRn Immunoassay 2. NanoLuc Binary Technology (NanoBiT) 5. Lumit Immunoassay Cellular System 8. Measurement of Relative Antibody Potency 3. Lumit™ Immunoassay Configurations 6. NF-B Signaling Pathway 9. Conclusions NanoLuc® Binary Technology (NanoBiT®), a two-part complementation system based on NanoLuc luciferase, is a proven technology for analyzing proteins at a cellular level. NanoBiT is comprised of an 11-amino acid subunit (low-affinity SmBiT or highaffinity HiBiT) that binds to its cognate large subunit partner (LgBiT) to form a bright luciferase that produces light when furimazine is added. We are building NanoBiT proximity immunoassays where complementary antibodies (or other affinity reagents) are labeled with NanoBiT subunits such that binding to analyte brings SmBiT and LgBiT into proximity, thereby producing signal proportional to analyte levels. This homogeneous detection chemistry has several advantages, including simple, add-and-read protocols, no requirement for sample transfer, no washes, and a broad linear dynamic range mitigating the need for sample dilutions. Moreover, time to assay completion is <30 to < 90 minutes, depending on the specific assay. In development are assays for detection of cytokines (e.g., IL-1β), metabolic targets (e.g., Insulin), FcRn binding, cellular pathway analyses (total and phospho-protein levels), as well as labeling kits to build your own Lumit immunoassays. Additional cytokine assays in development include, but are not limited to, IL-2, IL-4, IL-6, IL-10, IFN-g, TNF-a, and VEGF • Lumit FcRn Immunoassay is solution based; minimizes artifacts introduced by immobilization • Assay is homogeneous (add-and-read) and requires no washing • Luminescence based detection provides wide dynamic range and a large assay window • Assays are quick (30min) and require low sample volume (10-20µl) • Use of 96/384 well white plates enables flexible throughput and automation capabilities For Research Use Only. Not for use in diagnostic procedures. Corresponding author: dan.lazar@promega.com LgBiT (156 aa) C-terminal 11 aa Subunit Dixon, A.S., et al. (2016) NanoLuc complementation reporter optimized for accurate measurement of protein interactions in cells. ACS Chem. Biol. 11, 400-8. The small NanoLuc luciferase (19kDa) was divided into two subunits and individually optimized for assisted complementation Two subunits: • Large BiT (LgBiT; 17.6kDa) and • Small BiT (SmBiT; 11 amino acid peptide) LgBiT A B LgBiT SmBiT Low affinity =190µM Protein:Protein Interactions LgBiT SmBiT Luminescence Small and Bright NanoLuc Direct Indirect Competitive Analyte • Requires labeling primary antibodies • Avoids labeling of precious primary antibodies • Requires two different Ab species • Requires antibody and tracer labeling Labeled Tracer + Labeled Antibody + SmBiT LgBiT Analyte Analyte NanoBiT Luciferase NanoBiT Luciferase NanoBiT Luciferase Protocol for Detecting Released IL-1b from Cells 1 0 20,000 40,000 60,000 80,000 100,000 0.001 0.01 0.1 1 10 100 RLU LPS (EU/ml) LPS-treated THP-1 PMA-differentiated Undifferentiated 0 100,000 200,000 300,000 400,000 500,000 600,000 0.01 0.1 1 10 100 RLU LPS (EU/ml) LPS-treated PBMC Add labeled antibodies directly to cells w/ medium (or transfer medium to new plate) Add Lumit Detection Reagent to wells Plate and treat cells (cells release cytokines) Sample Plate GloMax ® Discover Record luminescence Total time: 70 min The assay is fast and homogeneous, with an easy “Add and Read” format Activation of NF-B Pathway with TNFα treatment in MCF-7 cells 0 10 20 30 0 20000 40000 60000 80000 Time(min) Luminescence (RLU) Total IBa Phospho-IBa Lumit IB detection reveals the predicted biology of NF-B signaling pathway upon TNF treatment: IBα phosphorylation (pS32) immediately followed by its fast degradation. Detection of Total and Phospho IBα upon TNF treatment 0 10 20 30 0 20000 40000 60000 80000 Time(min) Luminescence (RLU) Total IBa Phospho-IBa Detection of Total and Phospho IBα upon TNF treatment in the presence of MG132 Detection of the predicted response of NF-B pathway to the proteasome inhibitor treatment: decrease in IBα degradation and accumulation of phosphorylated IBα. - 2 0 2 4 0 2 0 4 0 6 0 8 0 1 0 0 1 2 0 F c R n P o t e n c y A s s a y L o g [ P a n i t u m u m a b ] , u g / m l N o r m a l i z e d R L U s 1 8 0 % 1 5 0 % 1 0 0 % 7 5 % 5 0 % 2 5 % 1 2 . 5 % 6 . 2 5 % IC50 180% 86.66 150% 113.9 100% 200.4 75% 231.1 50% 369.9 25% 604.7 12.5% 1203 6.25% 2553 Bioluminescent immunodetection platform based on NanoBiT technology • No-wash assay can be performed directly on cells • Fast, 30- to 90-minutes total time • Scalable for high throughput use • Large dynamic range reduces sample dilutions required • Uses standard plate-reading luminometer • Platform will include ready-to-use kits and reagents; user can create novel detection assays • Custom antibody labeling and immunoassay development available; Contact: CAS@promega.com Bioluminescent immunodetection platform based on NanoBiT technology Hwang, B., Engel, L., Goueli, S.A. et al. A homogeneous bioluminescent immunoassay to probe cellular signaling pathway regulation. Commun Biol 3, 8 (2020) doi:10.1038/s42003-019-0723-9 www.promega.com Novel Bioluminescent Tools to Study GPCR Pharmacology in Living Cells Steve Edenson1 , Brock Binkowski1 , Christopher Eggers 1 , Braeden Butler 1 , Rachel Friedman Ohana 1 , Michelle Boursier1 , Sergiy Levin2 , Thomas Machleidt1 , Kevin Hsiao1 , Said Goueli 1 , Keith Wood1 & Frank Fan1 1Promega Corporation, 2800 Woods Hollow Rd, Madison; 2Promega Biosciences LLC, 277 Granada Dr, San Luis Obispo, CA 1. Introduction 4. Ligand Binding Kinetics at 2-AR 2. Using HiBiT to Monitor GPCR Ligand Binding 5. Ligand Selectivity Profiling for -ARs 3. Analysis at Endogenous Expression Levels 6. Ligand-Induced β2-AR Internalization 9. Conclusions G-protein coupled receptors (GPCRs) continue to be prominent targets for new therapeutics. To support these efforts, we have developed a suite of bioluminescent assays to study GPCR pharmacology in real time in living cells. Quantification of ligand binding and receptor internalization relies on N-terminal fusion to High BiT (HiBiT), an 11 a.a. peptide. HiBiT binds with high affinity to Large BiT (LgBiT) to form NanoBiT Luciferase. For both applications, a non-lytic detection reagent is added containing cellimpermeable LgBiT and furimazine substrate. Ligand binding dynamics at the cell surface can be measured in real time through bioluminescent resonance energy transfer (BRET) between NanoBiT Luciferase and a fluorescent tracer. Receptor internalization and recycling are monitored in real time by measuring changes in the cell surface density of HiBiT-tagged GPCRs. Notably, the bright signal of NanoBiT Luciferase allows both assays to be run at endogenous levels of expression using CRISPR/Cas9 to introduce the HiBiT tag. Similarly, fusion proteins to LgBiT and Small BiT (SmBiT), an 11 a.a. peptide with low affinity binding to LgBiT, can be used to measure β-arrestin-1/2 recruitment to activated GPCRs in real time. Furthermore, changes in intracellular cAMP concentration can be sensitively measured using endpoint (cAMP-Glo) or real time formats (GloSensor cAMP) using thermal stable or circularly permuted forms of luciferase, respectively. These homogenous, cell-based assays, which are readily adaptable to laboratory automation, should be immensely useful in the study of GPCR pharmacology. For Research Use Only. Not for use in diagnostic procedures. January 2020 Corresponding author: steven.edenson@promega.com HiBiT tagging • Small: 11 amino acids • Highly sensitive Produces bright luminescence upon high affinity complementation with LgBiT, and allows analysis at endogenous expression levels • Selective cell surface detection: due to cell-impermeability of LgBiT • Simplified CRISPR/Cas9 knock-in Monitoring ligand-induced internalization • Quantitative: measures changes in cell-surface density of HiBiT-GPCRs Measuring ligand binding by BRET • Highly specific: due to the inherit distance constrains of BRET • Quantitative: binding affinity & kinetics • Non-radioactive & homogeneous live cell assay Ligand binding analysis for HiBiT-β2-AR Binding kinetics Similar binding constants from equilibrium & kinetic analyses • Rank order potencies are in general agreement with reported values. • Equilibrium and kinetic derived binding constants for agonists and antagonists were generally consistent Ki = (IC50 ) / (1 + ([Tracer] / KD ) Cheng-Prusoff equation Promega technology and assays for monitoring GPCR pharmacology: NanoBiT technology • Small tags minimize perturbation of fusion partner biology • Bright luminescence offers extreme sensitivity, e.g. endogenous levels of expression Measuring ligand binding by BRET • Highly specific: due to inherit distance constraints of BRET • Quantitative analyses of binding affinity & kinetics • Non-radioactive Monitoring ligand-induced internalization • Quantification of GPCR internalization and recycling • Kinetic and endpoint analyses Monitoring GPCR interactions with β-arrestin-2 • Simple protocol with robust S:B Real-time and endpoint assays for cAMP Homogeneous cell-based assays • Suitable for automation and high-throughput screening Fluorescent ligand binding Fluorescent ligand displacement Donor Acceptor Fluorescent ligand Binding Displacement Binding Displacement Transient (HiBiT-β2-AR) PC3 CRISPR (HiBiT-β2-AR) Treated cells were imaged on an Olympus LV200 luminescence microscope equipped with a Hamamatsu Image EM camera. Binding at equilibrium Analysis Propranolol-BODIPY propranolol Equilibrium KD (nM) 0.6 0.3 Kinetic KD (nM) 0.9 0.7 Kon (M-1 min -1 ) 13 x 10 7 470 x 10 7 Koff (min -1 ) 0.12 3.4 Ki (nM) timolol 0.7 pindolol 0.7 propranolol 0.8 alprenolol 0.8 salmeterol 2.2 carvedilol 4.1 formoterol 19 xamoterol 370 isoproterenol 770 salbutamol 1100 HiBiT-β2-AR Transient (HEK293) HiBiT-β2-AR CRISPR knock-in (PC3) End-point analysis Kinetic analysis • 2-AR internalization with various ligands is in general agreement with reported values • Monitor receptor internalization and recycling in real time 8. Real Time and Endpoint Assays for cAMP LgBiT SmBiT PM Barr2 P P PM Barr2 Agonist LgBiT SmBiT Internalization Transient or stable association for GPCR:Barr2 Barr2 P P SmBiT LgBiT 7. Monitor GPCR:β-arrestin-2 Interactions in Real Time Firefly-luciferase-based biosensor Real-time monitoring of changes in intracellular [cAMP] Sensitive assay with wide dynamic range cAMP • Monitor GPCR interactions with β-arrestin-1/2 in real-time • Small tags: 11 a.a. peptide (SmBiT) or 17.6 kDa protein (LgBiT) • Detect interactions using low levels of expression Increasing [Fractalkine] Sensitive, endpoint assay for [cAMP] in lysates Recycling 0 2000 4000 6000 10 5 10 6 CX3CR1:Barr2 Time (sec) Luminescence (RLU) www.promega.com Detection of Insulin Action and Steatosis Using New Bioluminescent Metabolite Assays Terry Riss, Maggie Bach, Mike Valley, Natasha Karassina, Donna Leippe, Jolanta Vidugiriene and Jim Cali Promega Corporation, 2800 Woods Hollow Rd, Madison, WI 53711 January 2020 1. Introduction 2. Bioluminescent Metabolite Assays 3. Model for NAFLD: Triglyceride Assay 9. Conclusions The combination of high blood pressure, central obesity, elevated blood sugar, and high levels of triglycerides and cholesterol known as “metabolic syndrome” result in increased risk for diabetes and cardiovascular disease. The action of insulin and the accumulation of lipids (i.e. steatosis) are two related factors that are involved with these conditions. The presence of insulin stimulates glucose uptake, suppresses lipolysis, and inhibits gluconeogenesis whereas insulin resistance leads to increased gluconeogenesis, decreased glucose uptake, and steatosis. The long-term occurrence of steatosis (e.g. NAFLD or NASH) can lead to chronic inflammation, cirrhosis, and potentially carcinoma. We have developed a portfolio of in vitro cellbased assays to detect specific metabolites using: 1) a biochemical approach with dehydrogenase enzymes coupled to the production of NAD(P)H and the generation of light from firefly luciferase or 2) an immunoassay approach using subunit complementation to form active NanoBiT® luciferase. Examples of the function and performance of these assays systems will be presented. For Research Use Only. Not for use in diagnostic procedures. Corresponding author: terry.riss@promega.com Based on bioluminescent NAD(P)H detection and can be rapidly applied for multiple metabolite detection Specific Dehydrogenase Metabolites Glycogen Glutamine Aspartate Triglycerides Cholesterol Esters Metabolites for Dehydrogenases Glucose Glutamate Lactate Amino Acids (BCAA) Glycerol Cholesterol NAD(P) Enzymes 0 50 100 150 200 0 5,000,000 10,000,000 15,000,000 20,000,000 triglyceride (uM) RLU control + FA 20,000 HepG2 cells per well were incubated overnight in the absence or presence of 0.3 mM BSA-bound linoleic and oleic acids. Lipid accumulation was measured using triglyceride detection assay. Glycerol release into the medium in 3T3-L1 MBX adipocytes treated for 90 minutes with different combinations of isoproterenol (25nM) and insulin (150nM). 0 20 40 60 80 100 120 glycerol (uM) Isoproterenol Insulin - - + - + + -4 -3 -2 -1 0 1 2 0 1 0 0 0 0 0 2 0 0 0 0 0 3 0 0 0 0 0 4 0 0 0 0 0 5 0 0 0 0 0 In s u lin [n M ] R L U g lu c o s e s e c re te d Insulin-mediated inhibition of gluconeogenesis measured by glucose secretion Insulin-mediated inhibition of lipolysis measured by glycerol secretion Spheroids formed from 2000 iCell ® Hepatocytes 2.0 (CDI) were washed and incubated with 10mM lactate, 2µM forskolin, and a titration of insulin for 6hrs. An aliquot of medium was then assayed with the glucose detection assay. NanoBiT System is based on a small and very bright NanoLuc luciferase and consist of: • 18kDa LgBiT with no luciferase activity • 11 a.a. peptides with different affinity for LgBiTs Expected relative Measured relative potency potency 50% day1 40.35% day2 38.80% 75% day1 71.22% day2 64.59% 150% day1 149.33% day2 170.94% Glucose Uptake-Glo as an Insulin Potency Assay using Differentiated 3T3 L1 MBX Adipocytes Differentiated 3T3 L1-MBX fibroblast → Adipocyte oil red Log Insulin, nM -4 -3 -2 -1 0 1 2 3 RLU 0 5e+4 1e+5 2e+5 2e+5 3e+5 3e+5 4e+5 4e+5 S/B = 10 EC50 = 0.1 nM Differentiated 3T3L1 adipocytes were treated with insulin, and the rate of glucose uptake was measured using bioluminescent detection. Insulin induces translocation of glucose transporters to the cell surface and increases glucose uptake in a dose-dependent manner. X Data -1.5 -1.0 -0.5 0.0 0.5 1.0 1.5 2.0 2.5 Y Data 0.0 2.0e+5 4.0e+5 6.0e+5 8.0e+5 1.0e+6 1.2e+6 1.4e+6 1.6e+6 1.8e+6 Data 2 Log(Insulin), nM To monitor GLUT4 translocation to the plasma: • HiBiT was inserted into extracellular loop of GLUT4 • Upon insulin stimulation, GLUT4-HiBiT is translocated to the plasma membrane and is measured by adding Detection Reagent containing LgBiT and NanoLuc substrate Measuring GLUT4-HiBiT translocation in C2C12 mouse myoblast stable clones Endpoint Assay Real Time Measurement GLUT4-HiBiT LgBiT + Substrate Insulin GLUT4-HiBiT HiBiT interreacts with LgBiT to produce light Anti-insulin antibody 1 with Large BiT Anti-insulin antibody 2 with Small BiT Complementation of BiTs in close proximity upon binding to insulin Active luciferase is formed and produces light Glucose Stimulated Insulin Secretion in INS-1 rat insulinoma cells in 384-well plates Insulin titration in 384-well plates Insulin containing samples Add antibodies conjugated with BiTs Incubate 1hr Add NanoLuc Substrate and Read Luminescence Bioluminescent metabolite assays and NanoBiT® technology are convenient tools for studying metabolic changes or evaluating biological activity of insulin and insulin analogues in cellular models: • Applicable for multiple metabolites in different sample types (cells, media, tissues) • Compatible with 96- and 384-well plates and standard plate readers • Can be used for studying receptor/transporter translocation to plasma membrane • Can be used to modify antibodies and provide an in-solution, no-wash Lumit™ immunoassay that is more rapid than conventional ELISA methods 4. Models for Gluconeogenesis and Lipolysis: Glucose and Glycerol Assays 5. Model for Studying Insulin Action: Glucose uptake Assay 6. NanoBiT System 7. Model for Studying Insulin Action in Muscle Cells: NanoBiT GLUT4 Translocation 8. Model for Islet Function: Lumit™ Immunoassay